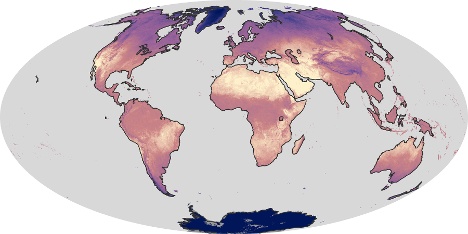
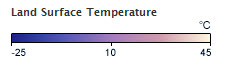
The above image from NASA shows surface temperatures around the world in September, 2010.
- What patterns do you see in regional temperatures?
- What general patterns would you expect to see on similar maps plotting precipitation, evaporation, and snow cover? How are these factors related?
- How would this map be different for March? December?